Donor retention rate benchmarks for major gifts teams in 2026
Donor retention benchmarks are widely reported and frequently cited. They're also, for major gifts professionals, often less useful than they look.
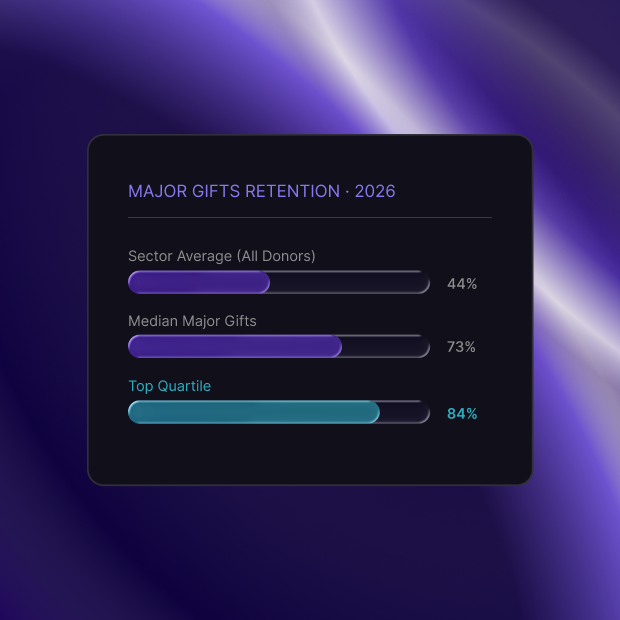
The sector-wide retention figure is somewhere around 43–46%, depending on the source and year blends, first-time donors, recurring small donors, and major donors, into a single number. First-time donor retention runs around 20–25%. Major donor retention runs around 70–75%. Averaging them together produces a figure that doesn't accurately describe any segment.
For a Director of Development trying to understand how their major gifts retention compares, the relevant benchmark isn't the sector average. It's the major gifts retention range specifically, and what drives the gap between where most programs land and where the top performers are.
What the major gifts retention picture actually looks like
Median performance: 70–75%
Programs with established major gifts infrastructure, consistent outreach cadences, and reasonable data hygiene tend to retain 70–75% of major donors year over year. This is where well-run programs land without systematic leading-indicator monitoring, good operational practice, consistent relationship work, but no real-time early warning when something starts to shift.
Top-quartile performance: 82–88%
Programs at the top of the range share a few consistent characteristics: tiered portfolio management practiced consistently (not just documented), a weekly or near-weekly engagement monitoring cadence rather than a quarterly one, and pre-call preparation that actually happens before significant interactions rather than being aspirational policy.
Programs under pressure: below 65%
Retention below 65% on a major gifts portfolio almost always reflects structural challenges: understaffing relative to portfolio size, inconsistent outreach cadence, data quality issues that make the CRM less reliable, or a culture where preparation happens reactively rather than systematically. These are solvable problems, but they require an honest assessment of which issue is actually driving the number.
Why sector averages mislead major gifts teams
The Fundraising Effectiveness Project's annual data, the most commonly cited benchmark source, tracks retention across all donor segments. First-time donors, mid-level donors, and major donors all go into the same analysis. The blended figure reflects the full acquisition-to-retention funnel, not the major gifts portfolio specifically.
Using that figure to evaluate a major gifts program is a bit like evaluating a hospital's surgical outcomes against average health statistics for the general population. The right comparison group is other major gifts programs, and within that group, the comparison that matters most is your own trend over time.
The metrics that predict next year's retention rate
Retention rate is a trailing indicator. The metrics that predict where it's headed and that are actionable today are:
Portfolio recency distribution
What percentage of your major donors have had personal contact in the past 30 days? 60 days? 90+? A portfolio where a significant portion of major donors haven't had personal interaction in 90+ days is carrying retention risk that won't show up in this year's rate but will show up in next year's.
Engagement breadth across the portfolio
Across your major donor base, how many are active across multiple engagement types, giving, events, communications response, and volunteering? Portfolio-level engagement breadth is one of the strongest predictors of year-over-year retention. Donors engaged in only one way are more fragile than donors engaged in three or four.
Single-relationship concentration
How many of your major donors have a relationship with only one person on your team? That's a structural retention risk that giving history alone won't reveal, because the risk isn't about the donor's engagement with your mission, it's about what happens to that relationship when the team changes.
What moves retention from the median to the top quartile
The difference between 73% and 84% retention on a major gifts portfolio is not primarily a function of better gift officers or larger relationship budgets. It's a function of systems.
Top-performing programs have monitoring that happens weekly rather than quarterly, preparation that happens before significant interactions rather than occasionally, and portfolio visibility that extends across all 200 relationships rather than focusing on the 20 the gift officer is thinking about this week.
Those aren't complicated systems. They're disciplines, and the difference between teams that sustain them and teams that don't is usually whether the underlying tools make them easy enough to actually do.
A note on 2026 context
The current fundraising environment adds specific weight to major gifts retention. Recent sector data shows that major gifts are driving an outsized share of total giving growth while small-donor acquisition becomes more competitive and expensive. The organizations that retain major donors well are compounding that advantage year over year.
An 84% retention rate versus a 73% retention rate, sustained over three years, produces a meaningfully different revenue picture even if both programs start from the same place. The retention work isn't just defensive, it's one of the highest-return investments a development operation can make.
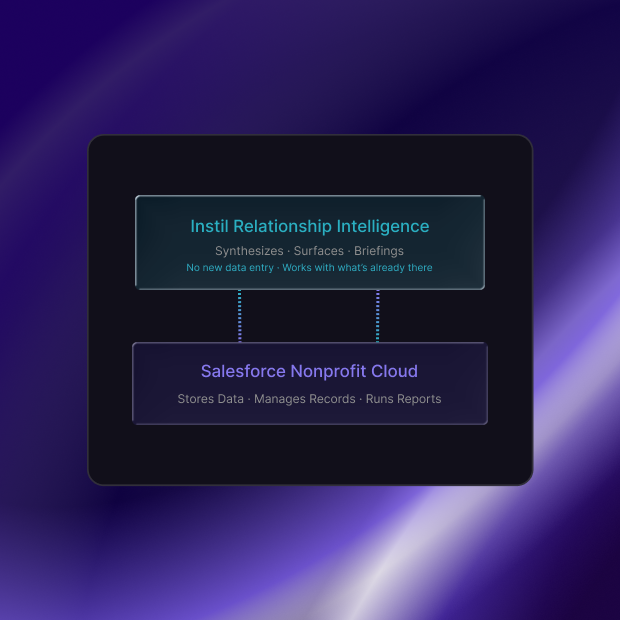
Want to see how Instil can increase your retention rate? We do a 20-minute portfolio conversation for major gifts teams.